# System Health Monitoring Daemon
[](https://code.lotusguild.org/LotusGuild/hwmonDaemon/actions?workflow=lint.yml)
[](https://code.lotusguild.org/LotusGuild/hwmonDaemon/actions?workflow=security.yml)
A robust system health monitoring daemon that tracks hardware status and automatically creates tickets for detected issues.

## ⚡ Quick run
Copy and paste on any Proxmox node (as root). No clone needed.
```bash
# Test it: prints the health summary and the tickets it WOULD create (nothing is sent)
python3 -c "import urllib.request; exec(urllib.request.urlopen('https://code.lotusguild.org/LotusGuild/hwmonDaemon/raw/branch/main/hwmonDaemon.py').read().decode('utf-8'))" --dry-run
# Run for real (creates tickets)
python3 -c "import urllib.request; exec(urllib.request.urlopen('https://code.lotusguild.org/LotusGuild/hwmonDaemon/raw/branch/main/hwmonDaemon.py').read().decode('utf-8'))"
# Install the systemd timer (hourly check)
curl -o /etc/systemd/system/hwmon.service https://code.lotusguild.org/LotusGuild/hwmonDaemon/raw/branch/main/hwmon.service && curl -o /etc/systemd/system/hwmon.timer https://code.lotusguild.org/LotusGuild/hwmonDaemon/raw/branch/main/hwmon.timer && systemctl daemon-reload && systemctl enable --now hwmon.timer
```
## Why this exists
A six-node Proxmox/Ceph cluster fails in small, boring ways: a drive starts reallocating sectors, a node runs hot, a pool fills up, Ceph reports slow operations. Nobody watches a dashboard all day, and a naive alert that fires every hour buries the one that matters. hwmonDaemon runs on every node, checks the hardware, and files **one ticket per real problem** in [Tinker Tickets](https://code.lotusguild.org/LotusGuild/tinker_tickets), with the diagnosis already written up.
```mermaid
flowchart LR
subgraph node["each Proxmox node (systemd timer)"]
smart["SMART + drive usage"] --> detect
sys["memory / CPU load / ECC"] --> detect
net["management + Ceph network"] --> detect
ceph["Ceph health + OSDs"] --> detect
lxc["LXC storage"] --> detect
detect{{"Detect + filter
sustained load, standing flags"}}
end
detect -->|"dedup key: category + host + device"| api["Tinker Tickets API"]
api -->|"open ticket exists"| upd["update it"]
api -->|"closed, problem recurs"| reopen["reopen it"]
api -->|"new problem"| new["create ticket"]
```
Design choices worth calling out:
- **Dedup by hash** of category + hostname + device, so a repeating alert updates the existing ticket and a recurrence reopens a closed one.
- **Sustained, not spiky:** CPU tickets are gated on the 15-minute load average per core, not a transient spike.
- **Knows the cluster:** a standing Ceph `noout` flag (set on purpose for a node without a UPS) is not ticketed.
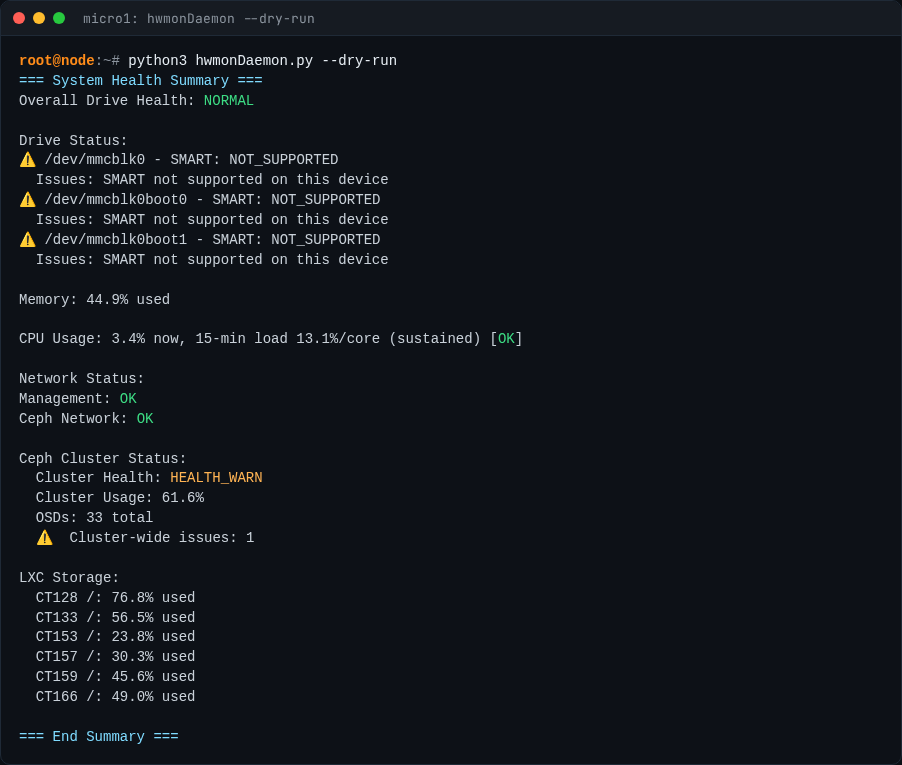
- **Dry-run first:** `--dry-run` prints exactly what would be filed, which is how the screenshots below were produced (on a live node, with nothing sent).
## Gallery
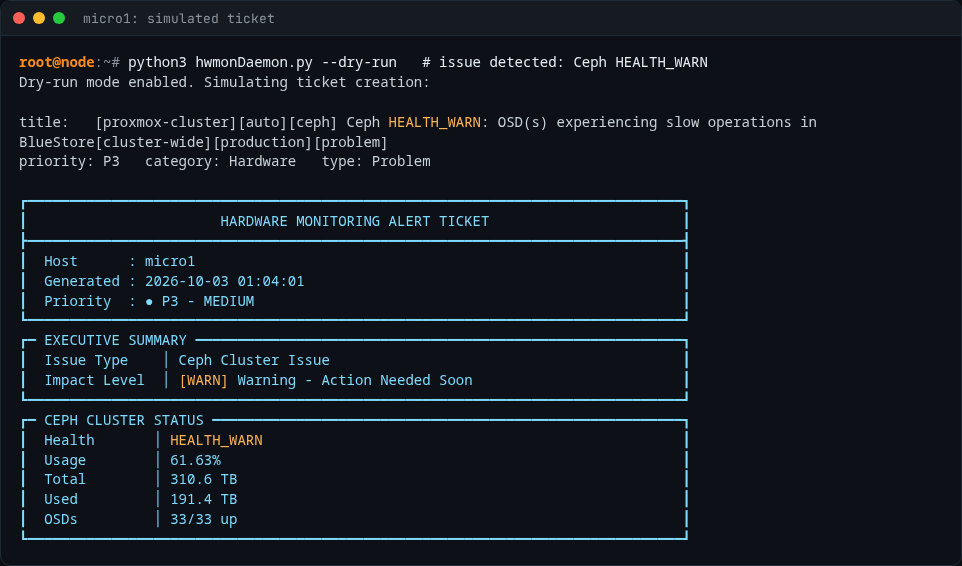
Output from a live node (`micro1`) in dry-run mode:
An issue was detected (Ceph reporting slow BlueStore operations), so the daemon renders the ticket it would create, including an executive summary and the cluster status:
Rendered from real command output with `scripts/render_terminal.py`.
## Features
- Comprehensive system health monitoring:
- Drive health (SMART status and disk usage)
- Memory usage
- CPU utilization
- Network connectivity (Management and Ceph networks)
- Automatic ticket creation for detected issues
- Configurable thresholds and monitoring parameters
- Dry-run mode for testing
- Systemd integration for automated daily checks
- LXC container storage monitoring
- Historical trend analysis for predictive failure detection
- Manufacturer-specific SMART attribute interpretation
- ECC memory error detection
## Installation
1. Copy the service and timer files to systemd:
```bash
sudo cp hwmon.service /etc/systemd/system/
sudo cp hwmon.timer /etc/systemd/system/
```
2. Reload systemd daemon:
```bash
sudo systemctl daemon-reload
```
3. Enable and start the timer:
```bash
sudo systemctl enable hwmon.timer
sudo systemctl start hwmon.timer
```
### One liner (run as root)
```bash
curl -o /etc/systemd/system/hwmon.service https://code.lotusguild.org/LotusGuild/hwmonDaemon/raw/branch/main/hwmon.service && curl -o /etc/systemd/system/hwmon.timer https://code.lotusguild.org/LotusGuild/hwmonDaemon/raw/branch/main/hwmon.timer && systemctl daemon-reload && systemctl enable hwmon.timer && systemctl start hwmon.timer
```
## Manual Execution
### Direct Execution (from local file)
1. Run the daemon with dry-run mode to test:
```bash
python3 hwmonDaemon.py --dry-run
```
2. Run the daemon normally:
```bash
python3 hwmonDaemon.py
```
### Remote Execution (same as systemd service)
Execute directly from repository without downloading:
1. Run with dry-run mode to test:
```bash
/usr/bin/env python3 -c "import urllib.request; exec(urllib.request.urlopen('https://code.lotusguild.org/LotusGuild/hwmonDaemon/raw/branch/main/hwmonDaemon.py').read().decode('utf-8'))" --dry-run
```
2. Run normally (creates actual tickets):
```bash
/usr/bin/env python3 -c "import urllib.request; exec(urllib.request.urlopen('https://code.lotusguild.org/LotusGuild/hwmonDaemon/raw/branch/main/hwmonDaemon.py').read().decode('utf-8'))"
```
## Configuration
The daemon monitors:
- Disk usage (warns at 80%, critical at 90%)
- LXC storage usage (warns at 80%, critical at 90%)
- Memory usage (warns at 80%)
- CPU usage (warns at 95%)
- Network connectivity to management (10.10.10.1) and Ceph (10.10.90.1) networks
- SMART status of physical drives with manufacturer-specific profiles
- Temperature monitoring (warns at 65°C)
- Automatic duplicate ticket prevention
- Enhanced logging with debug capabilities
## Data Storage
The daemon creates and maintains:
- **Log Directory**: `/var/log/hwmonDaemon/`
- **Historical SMART Data**: JSON files for trend analysis
- **Data Retention**: 30 days of historical monitoring data
- **Storage Limit**: Automatically enforced 10MB maximum
- **Cleanup**: Oldest files deleted first when limit exceeded
## Ticket Creation
The daemon automatically creates tickets with:
- Standardized titles including hostname, hardware type, and scope
- Detailed descriptions of detected issues with drive specifications
- Priority levels based on severity (P2-P4)
- Proper categorization and status tracking
- Executive summaries and technical analysis
## Dependencies
- Python 3
- Required Python packages:
- psutil
- requests
- System tools:
- smartmontools (for SMART disk monitoring)
- nvme-cli (for NVMe drive monitoring)
## Excluded Paths
The following paths are automatically excluded from monitoring:
- `/media/*`
- `/mnt/pve/mediafs/*`
- `/opt/metube_downloads`
- Pattern-based exclusions for media and download directories
## Service Configuration
The daemon runs:
- Hourly via systemd timer (with 60-second randomized delay)
- As root user for hardware access
- With automatic restart on failure
- 5-minute timeout for execution
- Logs to systemd journal
## Recent Improvements
**Version 2.0** (January 2026):
- ✅ Added 10MB storage limit with automatic cleanup
- ✅ File locking to prevent race conditions
- ✅ Disabled monitoring for unreliable Ridata drives
- ✅ Added timeouts to all network/subprocess calls (10s API, 30s subprocess)
- ✅ Fixed unchecked regex patterns
- ✅ Improved error handling throughout
- ✅ Enhanced systemd service configuration with restart policies
## Troubleshooting
```bash
# View service logs
sudo journalctl -u hwmon.service -f
# Check service status
sudo systemctl status hwmon.timer
# Manual test run
python3 hwmonDaemon.py --dry-run
```
## Security Note
Ensure proper network security measures are in place as the service downloads and executes code from a specified URL.
## CI
| Workflow | Purpose | Triggers |
|---|---|---|
| `lint.yml` | flake8 on all `.py` files | Every push and PR |
| `security.yml` | bandit `-ll` (medium+ severity) | Every push, PR, and weekly Monday 6am |
Branch protection is enabled on `main` — the lint check must pass before any PR can merge.
Lint config: `.flake8` (max-line-length 120, F841/E501 ignored).