# GANDALF (Global Advanced Network Detection And Link Facilitator)
[](https://code.lotusguild.org/LotusGuild/gandalf/actions?workflow=lint.yml)
[](https://code.lotusguild.org/LotusGuild/gandalf/actions?workflow=test.yml)
[](https://code.lotusguild.org/LotusGuild/gandalf/actions?workflow=security.yml)
> Because it shall not let problems pass.
Network monitoring dashboard for the LotusGuild Proxmox cluster.
Deployed on **LXC 157** (monitor-02 / 10.10.10.9), reachable at `gandalf.lotusguild.org`.
**Design System**: [web_template](https://code.lotusguild.org/LotusGuild/web_template) — shared CSS, JS, and layout patterns for all LotusGuild apps

## Why this exists
A Proxmox/Ceph cluster lives or dies by its network, and network problems are sneaky: a link that flaps, a fibre with weak receive power, a switch port that quietly negotiated 1 Gbps. GANDALF watches the cluster's links from three angles at once (host NIC state from Prometheus, switch ports and LLDP from the UniFi controller, and reachability pings), alerts only on **regressions** (a link that was up and went down; ports that were never connected are learned as baseline and ignored), and files one ticket per real problem. When something looks wrong, a click on the switch port runs a full on-host diagnostic through [PULSE](https://code.lotusguild.org/LotusGuild/pulse) (`ethtool`, SFP optics, kernel log, LLDP) and explains what it found.
## Gallery
**Dashboard**: alert queue with linked tickets, a live topology, per-host interface status and the UniFi device inventory.
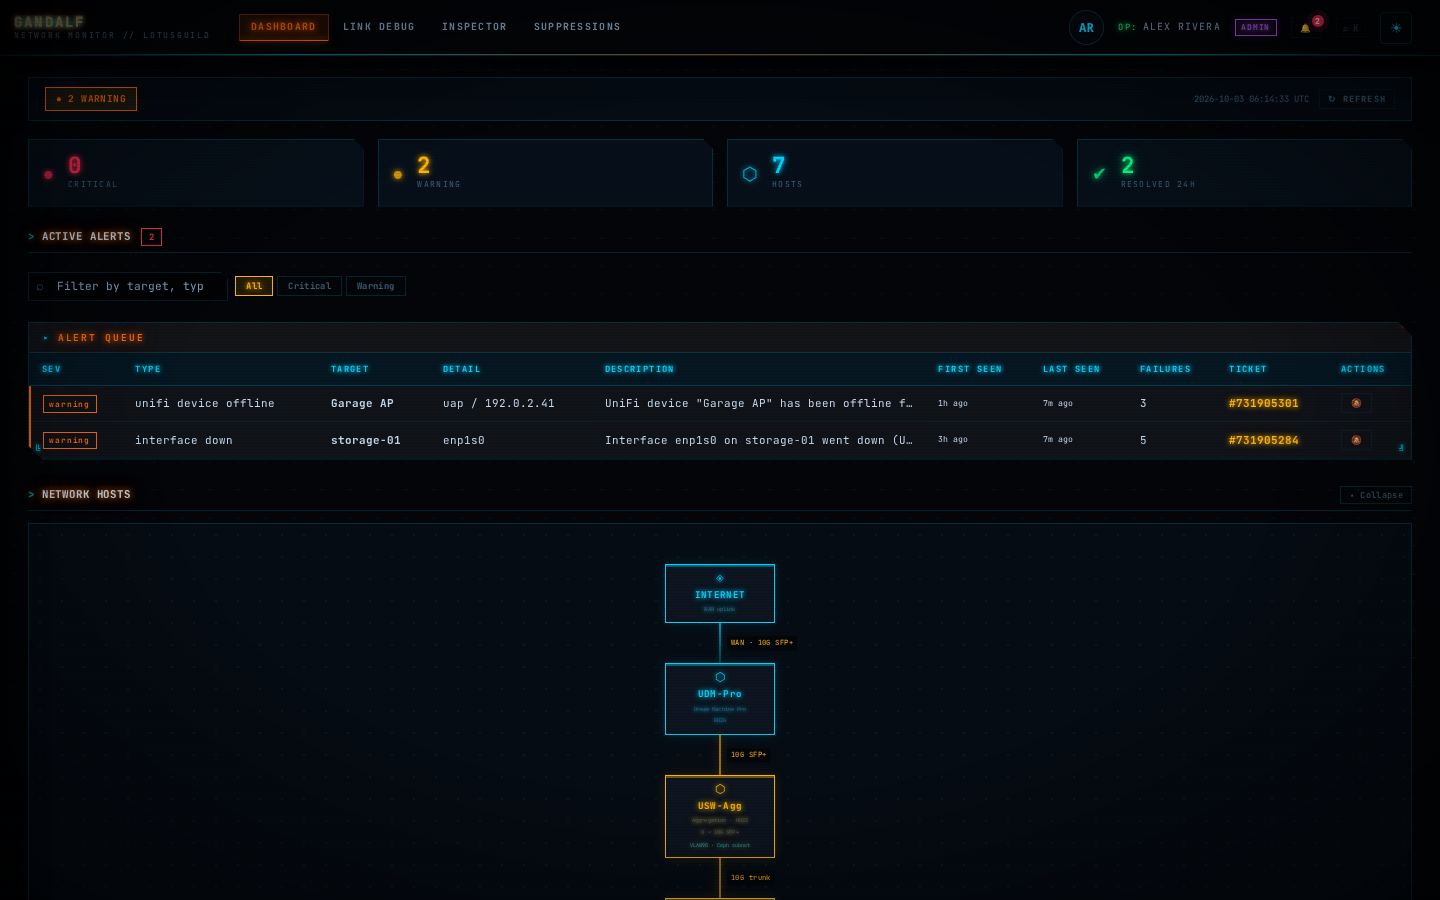


**Device pages**: search by hostname, IP, MAC, model or interface from the dashboard, then open one page per host, switch, router, PDU or modem. Each interface or port is one row with its state, speed, traffic and neighbour. Expanding a row shows duplex, carrier flaps, error and drop rates, PoE, LLDP, and **SFP optical readings** (temperature, TX/RX power) with colour-coded thresholds.
**Port inspector**: each switch and router page has a front-panel diagram. Click a port for its stats, LLDP neighbour and a side-by-side switch/server path check.

**One-click diagnostics**: GANDALF asks a PULSE worker to SSH to the host on the other end of the link and collect everything in one pass, then analyzes it: carrier, duplex and speed mismatches, SFP power levels, CRC errors, link flaps, recent kernel events and LLDP validation.

**Suppressions**: timed or manual maintenance windows per host, interface or UniFi device, with a full history.

**Light theme:**

Screenshots come from a throwaway local instance seeded with fictional data (documentation IP ranges), with PULSE replaced by a small mock. See `scripts/demo/`.
## Styling & Layout
GANDALF uses the **LotusGuild Terminal Design System**. For all styling, component, and layout documentation see:
- [`web_template/README.md`](https://code.lotusguild.org/LotusGuild/web_template/src/branch/main/README.md) — full component reference, CSS variables, JS API
- [`web_template/base.css`](https://code.lotusguild.org/LotusGuild/web_template/src/branch/main/base.css) — unified CSS (`.lt-*` classes)
- [`web_template/base.js`](https://code.lotusguild.org/LotusGuild/web_template/src/branch/main/base.js) — `window.lt` utilities (toast, modal, auto-refresh, fetch helpers)
- [`web_template/python/base.html`](https://code.lotusguild.org/LotusGuild/web_template/src/branch/main/python/base.html) — Jinja2 base template
- [`web_template/python/auth.py`](https://code.lotusguild.org/LotusGuild/web_template/src/branch/main/python/auth.py) — `@require_auth` decorator pattern
---
## Architecture
Two processes share a MariaDB database:
| Process | Service | Role |
|---|---|---|
| `app.py` | `gandalf.service` | Flask web dashboard (gunicorn, port 8000) |
| `monitor.py` | `gandalf-monitor.service` | Background polling daemon |
```
[Prometheus :9090] ──▶
[UniFi Controller] ──▶ monitor.py ──▶ MariaDB ◀── app.py ──▶ nginx ──▶ Authelia ──▶ Browser
[Pulse Worker] ──▶
[SSH / ethtool] ──▶
[AT&T BGW320] ──▶
```
### Data Sources
| Source | What it provides |
|---|---|
| **Prometheus** (`10.10.10.48:9090`) | Physical NIC link state + traffic/error rates via `node_exporter` |
| **UniFi API** (`https://10.10.10.1`) | Switch port stats, device status, LLDP neighbor table, PoE data |
| **Pulse Worker** | SSH relay — runs `ethtool` + SFP DOM queries on each Proxmox host |
| **Ping** | Reachability for hosts without `node_exporter` (e.g. PBS) |
| **AT&T BGW320** (`http://192.168.1.254`) | Fiber light levels, PON and WAN state, WAN counters, scraped read-only from the gateway's status pages (no login) |
### Monitored Hosts (Prometheus / node_exporter)
| Host | Prometheus Instance |
|---|---|
| large1 | 10.10.10.2:9100 |
| compute-storage-01 | 10.10.10.4:9100 |
| micro1 | 10.10.10.8:9100 |
| monitor-02 | 10.10.10.9:9100 |
| compute-storage-gpu-01 | 10.10.10.10:9100 |
| storage-01 | 10.10.10.11:9100 |
Ping-only (no node_exporter): **pbs** (10.10.10.3)
---
## Pages
### Dashboard (`/`)
- Device search (see Device pages below)
- Active alerts first, then the WAN / Fiber panel, hosts, UniFi devices, topology, and recently resolved alerts
- Real-time host status grid with per-NIC link state (UP / DOWN / degraded)
- Network topology diagram (Internet → Modem → Gateway → Switches → Hosts)
- WAN / Fiber panel: WAN and PON state, Rx/Tx power, optics temperature, throughput, errors, gateway uptime and last restart, 7-day Rx trend, recent WAN outages
- UniFi device table (switches, APs, gateway)
- Active alerts table with severity, target, consecutive failures, ticket link
- Quick-suppress modal: apply timed or manual suppression from any alert row
- Auto-refreshes every 30 seconds via `/api/status` + `/api/network`
### Device pages (`/device/`)
One page per host, switch, router, AP, PDU, or modem. Reach them from the search box on the
dashboard (`/` focuses it), or from any device name. Search matches hostname, IP, MAC, model, type,
interface and port names, and LLDP neighbors.
- **Overview**: status, IP, MAC, model, firmware, uptime, CPU, memory, clients, temperatures, power draw
- **Alerts**: active and past alerts for this device
- **WAN** (routers): connection state, speed, latency, availability
- **Connected to** (hosts): switch ports that see this host over LLDP
- **Outlets** (PDUs): per-outlet state, power, and auto power-cycle setting
- **Port inspector** (switches, routers): see below
- **Interfaces / Ports**: one row each with state, speed, RX/TX rate, and neighbor, filterable.
Expanding a host's row shows duplex, auto-negotiation, carrier changes, error and drop rates,
traffic bars, PoE, LLDP detail, and the **SFP / optical panel** (vendor/PN, temperature, voltage,
bias, TX/RX power, RX−TX delta)
- **WAN / Fiber** (modem): the same panel as the dashboard
These replaced the Link Debug page; `/links` now redirects to the dashboard. Hosts that Prometheus
sees but `config.json` doesn't list still get a page, with their state shown as unknown because
they aren't alerted on.
### Port inspector (on switch and router device pages)
A model-accurate front panel, drawn from the layout config in `static/port-inspector.js`
(`SWITCH_LAYOUTS`). `/inspector` now redirects to the dashboard. Link to a port with `/device/#port-`.
**Port block colours:**
| Colour | State |
|---|---|
| Green | Up, no active PoE |
| Amber | Up with active PoE draw |
| Cyan | Uplink port (up) |
| Grey | Down |
| White outline | Currently selected |
**Clicking a port**, on the panel or in the port table, opens the detail panel showing:
- Link stats (status, speed, duplex, auto-neg, media type)
- PoE (class, max wattage, current draw, mode)
- Traffic (TX/RX rates)
- Errors/drops per second
- **LLDP Neighbor** section (system name, port ID, chassis ID, management IPs)
- **Path Debug** (auto-appears when LLDP `system_name` matches a known server):
two-column comparison of the switch port stats vs. the server NIC stats,
including SFP DOM data if the server side has an SFP module
**Port neighbors**: UniFi's LLDP data identifies a neighbor only by MAC, so Gandalf names it by matching that MAC
against host NICs (`node_network_info` from node_exporter) and UniFi devices, then falling back to management IPs.
Servers that don't send LLDP are found through UniFi's wired client table. Uplink ports are skipped there, and
neighbors that can't be matched show their MAC. Bonded NICs share a MAC, so only one member's port may be identified.
**Path check and diagnostics requirements:**
1. The server's node_exporter is scraped, so its NIC MACs are in Prometheus
2. The Pulse worker can SSH to the server
3. Optional: `lldpd` on the server lets diagnostics confirm the cabling from the server's side
**Supported switch models** (set `SWITCH_LAYOUTS` keys to your UniFi model codes):
| Key | Model | Layout |
|---|---|---|
| `USF5P` | UniFi Switch Flex 5 PoE | 4×RJ45 + 1×SFP uplink |
| `USL8A` | UniFi Switch Lite 8 PoE | 8×SFP (2 rows of 4) |
| `US24PRO` | UniFi Switch Pro 24 | 24×RJ45 staggered + 2×SFP |
| `USPPDUP` | Custom/other | Single-port fallback |
| `UDMPRO` | Dream Machine Pro | 9×RJ45 + 2×SFP+ |
| `USMINI` | UniFi Switch Mini | 5-port row |
Add new layouts by adding a key to `SWITCH_LAYOUTS` matching the `model` field
returned by the UniFi API for that device.
### Suppressions (`/suppressions`)
- Create timed (30 min / 1 hr / 4 hr / 8 hr) or manual suppressions
- Target types: host, interface, UniFi device, or global
- Active suppressions table with one-click removal
- Suppression history (last 50)
- Available targets reference grid (all known hosts + interfaces)
---
## Alert Logic
### Ticket Triggers
| Condition | Priority |
|---|---|
| UniFi device offline (≥`unifi_failure_threshold` consecutive checks) | P2 High |
| Proxmox host NIC link-down regression (≥2 consecutive checks) | P2 High |
| Host unreachable via ping (≥2 consecutive checks) | P2 High |
| Configured host has no metrics in Prometheus (host or `node_exporter` down, ≥2 consecutive checks) | P2 High |
| Prometheus unavailable, so host and interface alerting is paused (≥2 consecutive checks) | P2 High |
| ≥3 hosts simultaneously reporting interface or metrics failures | P1 Critical |
| WAN down: broadband or optical status not Up, or PON not in O5 (≥`modem.failure_threshold`) | P1 Critical |
| Modem not responding (≥`modem.failure_threshold`) | P2 High |
| Fiber Rx/Tx power or optics temperature in the module's alarm range, or a supply voltage or Tx bias alarm flag (≥`modem.failure_threshold`) | P2 High |
| Fiber reading in the module's warning range (≥`modem.failure_threshold`) | P3 |
| Rx power `rx_drift_db` or more below its 7-day median (≥`modem.failure_threshold`) | P3 |
| Modem pages unreadable, e.g. after a firmware update (≥`modem.failure_threshold`) | P3 |
| UniFi logs that Smart Power auto power-cycled the modem | P3 |
| UniFi logs that the WAN failed multiple times in 24 hours (at most one ticket a day) | P2 |
A failed Pulse ping check counts as "unknown": it neither raises nor resolves `host_unreachable`.
### WAN modem notes
The alarm and warning limits are read from the gateway on every poll, so they are never hard-coded here.
Those limits are wide (warning at -27.9 dBm on a link that normally sits near -17), so `fiber_rx_drift`
compares each reading to the link's own 7-day median to catch a damaged connector earlier. It stays quiet
until `rx_drift_min_samples` readings exist (about a day at a 5 minute poll).
Outages can be over between polls: two real ones lasted about two minutes against a 5 minute poll.
So WAN outages and modem restarts also come from the UniFi system log, and a drop in the modem's uptime
records a restart even if nothing logged it. A single short outage only appears in the panel's history.
To silence modem alerts during maintenance, create a `host` suppression with the modem's `name`.
### Baseline Tracking
Interfaces that are **down on first observation** (unused ports, unplugged cables)
are recorded as `initial_down` and never alerted. Only **UP→DOWN regressions**
generate tickets. Baseline is stored in MariaDB and survives daemon restarts.
### Suppression Targets
| Type | Suppresses |
|---|---|
| `host` | All interface alerts for a named host |
| `interface` | A specific NIC on a specific host |
| `unifi_device` | A specific UniFi device |
| `all` | Everything (global maintenance mode) |
Suppressions can be manual (persist until removed) or timed (auto-expire).
Expired suppressions are checked at evaluation time — no background cleanup needed.
---
## Configuration (`config.json`)
Shared by both processes. Located in the working directory (`/var/www/html/prod/`).
```json
{
"database": {
"host": "10.10.10.50",
"port": 3306,
"user": "gandalf",
"password": "...",
"name": "gandalf"
},
"prometheus": {
"url": "http://10.10.10.48:9090"
},
"unifi": {
"controller": "https://10.10.10.1",
"api_key": "...",
"site_id": "default"
},
"ticket_api": {
"url": "https://t.lotusguild.org/api/tickets",
"api_key": "..."
},
"pulse": {
"url": "http://:",
"api_key": "...",
"worker_id": "...",
"timeout": 45
},
"auth": {
"allowed_groups": ["admin"]
},
"hosts": [
{ "name": "large1", "prometheus_instance": "10.10.10.2:9100" },
{ "name": "compute-storage-01", "prometheus_instance": "10.10.10.4:9100" },
{ "name": "micro1", "prometheus_instance": "10.10.10.8:9100" },
{ "name": "monitor-02", "prometheus_instance": "10.10.10.9:9100" },
{ "name": "compute-storage-gpu-01", "prometheus_instance": "10.10.10.10:9100" },
{ "name": "storage-01", "prometheus_instance": "10.10.10.11:9100" }
],
"monitor": {
"poll_interval": 120,
"failure_threshold": 2,
"unifi_failure_threshold": 5,
"cluster_threshold": 3,
"ping_hosts": [
{ "name": "pbs", "ip": "10.10.10.3" }
]
},
"modem": {
"url": "http://192.168.1.254",
"name": "att-modem"
}
}
```
### Key Config Fields
| Key | Description |
|---|---|
| `database.*` | MariaDB credentials (LXC 149 at 10.10.10.50) |
| `prometheus.url` | Prometheus base URL |
| `unifi.controller` | UniFi controller base URL (HTTPS, self-signed cert ignored) |
| `unifi.api_key` | UniFi API key from controller Settings → API |
| `unifi.site_id` | UniFi site ID (default: `default`) |
| `ticket_api.api_key` | Tinker Tickets bearer token |
| `pulse.url` | Pulse worker API base URL (for SSH relay) |
| `pulse.worker_id` | Which Pulse worker runs ethtool collection |
| `pulse.timeout` | Max seconds to wait for SSH collection per host |
| `auth.allowed_groups` | Authelia groups that may access Gandalf |
| `hosts` | Maps Prometheus instance labels → display hostnames |
| `monitor.poll_interval` | Seconds between full check cycles (default: 120) |
| `monitor.failure_threshold` | Consecutive failures before creating ticket (default: 2) |
| `monitor.unifi_failure_threshold` | Consecutive failures before ticketing a UniFi device as offline (default: same as `failure_threshold`). Set higher than `failure_threshold` — UniFi switches/APs can take several minutes to rejoin after a firmware-update reboot, so a low threshold cuts tickets for momentary maintenance reboots instead of real failures. |
| `monitor.cluster_threshold` | Hosts with failures to trigger cluster-wide P1 (default: 3) |
| `monitor.ping_hosts` | Hosts checked only by ping (no node_exporter) |
| `modem.url` | AT&T gateway base URL. Omit the `modem` block to disable modem monitoring. Must be reachable from the monitor host. |
| `modem.name` | Name used for the modem's alerts, tickets, and suppressions (default: `att-modem`) |
| `modem.timeout` | Seconds to wait per status page (default: 10) |
| `modem.failure_threshold` | Consecutive failures before ticketing a modem alert (default: same as `failure_threshold`). Raise it if gateway reboots or automatic firmware updates cut tickets. |
| `modem.rx_drift_db` | Rx drop below the 7-day median that raises `fiber_rx_drift` (default: 3.0) |
| `modem.rx_drift_min_samples` | Readings required before drift alerts start (default: 288) |
---
## Deployment (LXC 157)
### 1. Database — MariaDB LXC 149 (`10.10.10.50`)
```sql
CREATE DATABASE gandalf CHARACTER SET utf8mb4 COLLATE utf8mb4_unicode_ci;
CREATE USER 'gandalf'@'10.10.10.61' IDENTIFIED BY 'your_password';
GRANT ALL PRIVILEGES ON gandalf.* TO 'gandalf'@'10.10.10.61';
FLUSH PRIVILEGES;
```
Import schema:
```bash
mysql -h 10.10.10.50 -u gandalf -p gandalf < schema.sql
```
### 2. LXC 157 — Install dependencies
```bash
pip3 install -r requirements.txt
# Ensure sshpass is available (used by deploy scripts)
apt install sshpass
```
### 3. Deploy files
```bash
# From dev machine / root/code/gandalf:
for f in app.py db.py monitor.py config.json schema.sql \
static/style.css static/app.js \
templates/*.html; do
sshpass -p 'yourpass' scp -o StrictHostKeyChecking=no \
"$f" "root@10.10.10.61:/var/www/html/prod/$f"
done
systemctl restart gandalf gandalf-monitor
```
### 4. systemd services
**`gandalf.service`** (Flask/gunicorn web app):
```ini
[Unit]
Description=Gandalf Web Dashboard
After=network.target
[Service]
Type=simple
WorkingDirectory=/var/www/html/prod
ExecStart=/usr/bin/python3 -m gunicorn --workers 1 --bind 127.0.0.1:8000 app:app
Restart=always
[Install]
WantedBy=multi-user.target
```
**`gandalf-monitor.service`** (background polling daemon):
```ini
[Unit]
Description=Gandalf Network Monitor Daemon
After=network.target
[Service]
Type=simple
WorkingDirectory=/var/www/html/prod
ExecStart=/usr/bin/python3 monitor.py
Restart=always
[Install]
WantedBy=multi-user.target
```
### 5. Authelia rule (LXC 167)
```yaml
access_control:
rules:
- domain: gandalf.lotusguild.org
policy: one_factor
subject:
- group:admin
```
```bash
systemctl restart authelia
```
### 6. NPM reverse proxy
- **Domain:** `gandalf.lotusguild.org`
- **Forward to:** `http://10.10.10.61:8000` (gunicorn direct, no nginx needed on LXC)
- **Forward Auth:** Authelia at `http://10.10.10.167:9091`
- **WebSockets:** Not required
---
## Service Management
```bash
# Status
systemctl status gandalf gandalf-monitor
# Logs (live)
journalctl -u gandalf -f
journalctl -u gandalf-monitor -f
# Restart after code or config changes
systemctl restart gandalf gandalf-monitor
```
---
## Troubleshooting
### Avatar photo missing (`/api/avatar` returns 404)
`journalctl -u gandalf | grep -i avatar` gives the reason: `no ldap.host / ldap.bind_dn` (missing config),
`ldap3 not installed` (run `pip3 install -r requirements.txt`), `LDAP avatar lookup failed` (bind or network),
`LDAP has no photo` (or `Remote-User` doesn't match a uid), or a cached `no photo` marker, which expires
after `ldap.cache_ttl` seconds or can be removed from `ldap.cache_dir`.
### Monitor not creating tickets
- Verify `config.json → ticket_api.api_key` is set and valid
- Check `journalctl -u gandalf-monitor` for `Ticket creation failed` lines
- Confirm the Tinker Tickets API is reachable from LXC 157
### WAN / Fiber panel missing or showing "unavailable"
- The panel stays hidden until `config.json → modem.url` is set and the monitor has completed a cycle
- Test from the monitor host: `curl -s -o /dev/null -w '%{http_code}\n' http://192.168.1.254/cgi-bin/fiberstat.ha` should print `200`
- `modem_data_invalid` means the gateway answered but its pages couldn't be parsed. AT&T updates firmware automatically, so compare the page against the parsers in `modem.py` (markup confirmed on BGW320-505 firmware 6.35.8)
### Device pages show no interface data
- Check `gandalf-monitor.service` is running and has completed at least one cycle
- Check `journalctl -u gandalf-monitor` for Prometheus or UniFi errors
- Verify Prometheus is reachable: `curl http://10.10.10.48:9090/api/v1/query?query=up`
### Device page: SFP / optical panel missing
- SFP data requires Pulse worker + SSH access to hosts
- Verify `config.json → pulse.*` is configured and the Pulse worker is running
- Confirm `sshpass` + SSH access from the Pulse worker to each Proxmox host
- Only interfaces with physical SFP modules return DOM data (`ethtool -m`)
### Port inspector: path check or Run Diagnostics not appearing
- These need the port's neighbor to be a host with link stats. A port showing only a MAC couldn't be matched
- Check that the server's node_exporter is scraped and reports `node_network_info` for that NIC
- Hosts missing from `config.json` are named by IP, so their ports may not match what you expect
### Port inspector: front panel shows as a flat list (no layout)
- The switch's `model` field from UniFi doesn't match any key in `SWITCH_LAYOUTS` in `port-inspector.js`
- The model is shown on the device page
- Add the model key to `SWITCH_LAYOUTS` in `port-inspector.js` with the correct row/SFP layout
### Baseline re-initializing on every restart
- `interface_baseline` is stored in the `monitor_state` DB table; survives restarts
- If it appears to reset: check DB connectivity from the monitor daemon
### Interface stuck at "initial_down" forever
- This means the interface was down when the monitor first saw it
- It will begin tracking once it comes up; or manually clear it:
```sql
-- In MariaDB on 10.10.10.50:
UPDATE monitor_state SET value='{}' WHERE key_name='interface_baseline';
```
Then restart the monitor: `systemctl restart gandalf-monitor`
### Prometheus data missing for a host
```bash
# On the affected host:
systemctl status prometheus-node-exporter
# Verify it's scraped:
curl http://10.10.10.48:9090/api/v1/query?query=up | jq '.data.result[] | select(.metric.job=="node")'
```
---
## Development Notes
### File Layout
```
gandalf/
├── app.py # Flask web app (routes, auth, API endpoints)
├── monitor.py # Background daemon (Prometheus, UniFi, Pulse, alert logic)
├── modem.py # Read-only AT&T gateway status page client and parser
├── devices.py # Device inventory for search and device pages
├── db.py # Database operations (MariaDB via pymysql, thread-local conn reuse)
├── schema.sql # Database schema (network_events, suppression_rules, monitor_state)
├── config.json # Runtime configuration (not committed with secrets)
├── requirements.txt # Python dependencies
├── static/
│ ├── style.css # Terminal aesthetic CSS (CRT scanlines, green-on-black)
│ ├── app.js # Dashboard JS (auto-refresh, events, suppress modal, search, modem panel)
│ ├── device.js # Device page rendering
│ └── port-inspector.js # Switch front panel, port panel, path check, diagnostics
└── templates/
├── base.html # Shared layout (header, nav, footer)
├── index.html # Dashboard page
├── device.html # Per-device page
├── _modem_panel.html # WAN / Fiber panel, shared by the dashboard and modem page
└── suppressions.html # Suppression management page
```
### Adding a New Monitored Host
1. Install `prometheus-node-exporter` on the host
2. Add a scrape target to Prometheus config
3. Add an entry to `config.json → hosts`:
```json
{ "name": "newhost", "prometheus_instance": "10.10.10.X:9100" }
```
4. Restart monitor: `systemctl restart gandalf-monitor`
5. For SFP DOM / ethtool: ensure the host is SSH-accessible from the Pulse worker
### Adding a New Switch Layout
Find the UniFi model code for the switch (shown on its device page), then add to `SWITCH_LAYOUTS` in
`static/port-inspector.js`:
```javascript
'MYNEWMODEL': {
rows: [[1,2,3,4,5,6,7,8], [9,10,11,12,13,14,15,16]], // port_idx by row
sfp_section: [17, 18], // separate SFP cage ports (rendered below rows)
sfp_ports: [], // port_idx values that are SFP-type within rows
},
```
### Database Schema Notes
- `network_events`: one row per active event; `resolved_at` is set when recovered
- `suppression_rules`: `active=FALSE` when removed; `expires_at` checked at query time
- `monitor_state`: key/value store; `interface_baseline`, `link_stats`, and `modem_stats` are JSON blobs
- `monitor_state` also holds `wan_history` (WAN outages, modem restarts) and `unifi_log_cursor` (how far the UniFi log has been read)
- Database sessions run in UTC (`db.py`), whatever the server's time zone
- `modem_samples`: optical readings per poll, kept 90 days; created automatically at monitor startup
### Security Notes
- **XSS prevention**: all user-controlled data in dynamically generated HTML uses
`escHtml()` (JS) or Jinja2 auto-escaping (Python). Suppress buttons use `data-*`
attributes + a single delegated click listener rather than inline `onclick` with
interpolated strings.
- **Interface name validation**: `monitor.py` validates SSH interface names against
`^[a-zA-Z0-9_.@-]+$` before use, and additionally wraps them with `shlex.quote()`
for defense-in-depth.
- **DB parameters**: all SQL uses parameterised queries via pymysql — no string
concatenation into SQL.
- **Auth**: Authelia enforces admin-only access at the nginx/LXC 167 layer; the Flask
app additionally checks the `Remote-User` header via `@require_auth`.
### Known Limitations
- Single gunicorn worker (`--workers 1`) — required because `db.py` uses thread-local
connection reuse (one connection per thread). Multiple workers would each have their
own connection, which is fine, but the thread-local optimisation only helps within
one worker.
- No CSRF tokens on API endpoints — mitigated by Authelia session cookies being
`SameSite=Strict` and the site being admin-only.
- SSH collection via Pulse is synchronous — if Pulse is slow, the entire monitor cycle
is delayed. The `pulse.timeout` config controls the max wait.
- UniFi LLDP data is only as fresh as the last monitor poll (120s default).
---
## CI / CD
| Workflow | Purpose | Triggers |
|---|---|---|
| `lint.yml` (python-lint) | flake8 on all `.py` files | Every push and PR |
| `lint.yml` (js-lint) | ESLint on `static/` | Every push and PR |
| `test.yml` | pytest — `diagnose.py`, `modem.py`, and `monitor.py` alert logic | Every push and PR |
| `security.yml` | bandit `-ll` (medium+ severity) | Every push, PR, and weekly Monday 6am |
| `deploy` job in `lint.yml` | Calls the `gandalf-deploy` webhook on CT157 (10.10.10.61) | Push to `main` only, after both lint jobs pass |
Branch protection is enabled on `main` — both lint jobs must pass before any PR can merge.
Tests live in `tests/`:
- `test_diagnose.py`: `DiagnosticsRunner` static methods (`build_ssh_command`, `parse_output`,
`parse_sysfs_stats`, `parse_ethtool`, and variants)
- `test_modem.py`: gateway page parsing, optical status, and WAN state
- `test_monitor.py`: alert logic for dead hosts, Prometheus and Pulse outages, and modem and WAN log events
- `test_devices.py`: device inventory behind search and device pages
- `test_app.py`: page and API routes